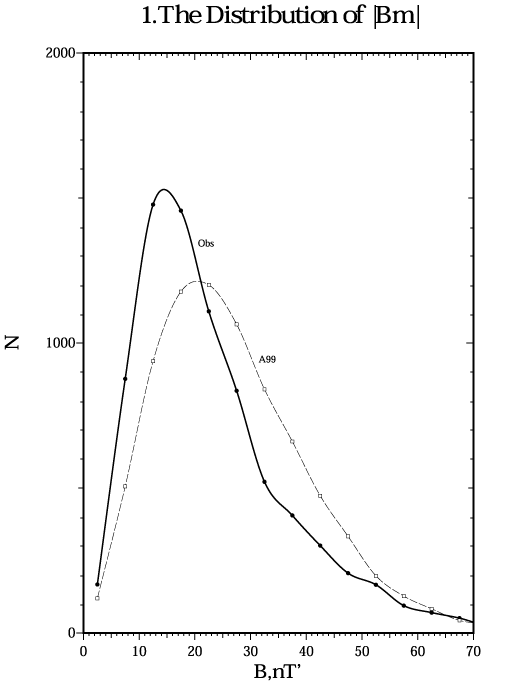
Accuracy of the Model and Comparison
With Experimental
Data
A1. Stationary Case. Comparison with the
Large Magnetosphere Magnetic Field Data Base
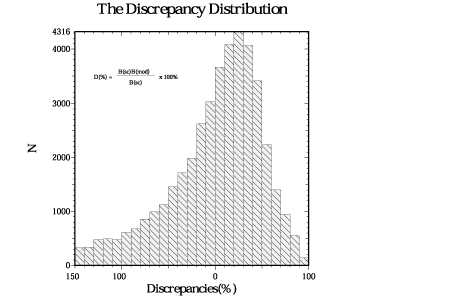
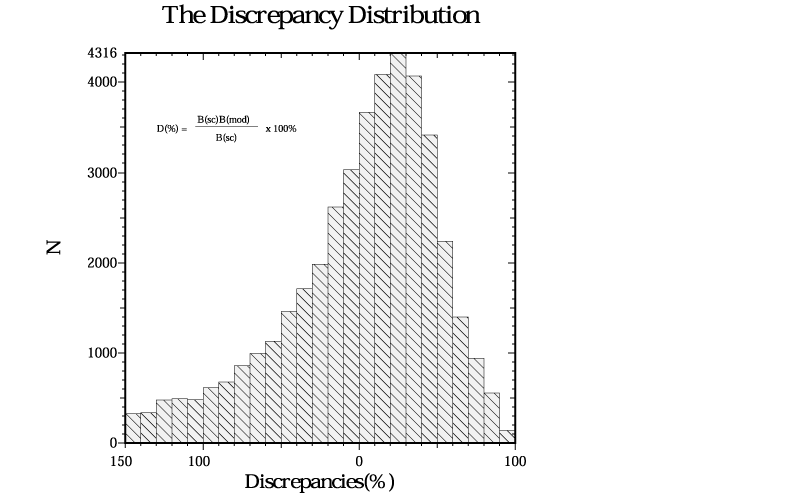
Figure 1: The distribution of discrepancies of
magnetospheric field magnetic induction calculated in term of the parabolic
model, compared with experimental data. B(sc)\protect ,nT, is
the field measured onboard spacecrafts, B(mod)\protect ,nT, is
the field calculated in terms of the parabolic model, N is for
statistics.
The comparison with the Large Magnetosphere Magnetic Field Data Base
(Faierfield et al., Journal of Geophysical Research, V.99, p.11319-11326, 1994)
was made. Data base includes data of Explorer 33,35, IMPs 4,5,6,7,8, Heos 1,2
and ISEE 1, 2 in the region between 4 and 60 RE . Calculations of the
input parameters of the model were performed using solar wind data, Dst and AL indices which are contained in Data Base. Parameters y,R1,FĄ were calculated in terms of submodels presented in
Appendix 1 of Working Draft. Field-aligned currents magnetic field was not taken
into account in these calculations as the first step of the model evaluation.
It was supposed
where
jk is the midnight latitude of the equatorward boundary of the
auroral oval.
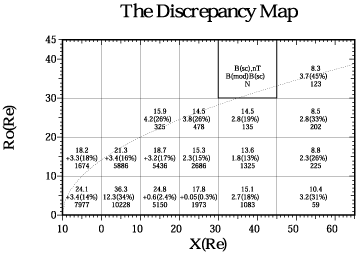
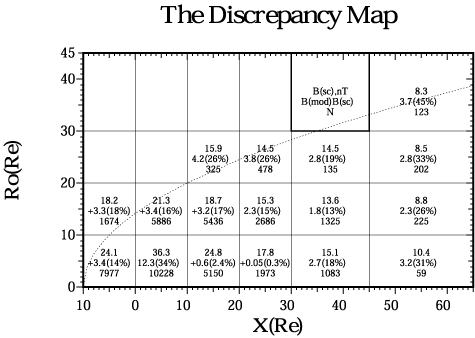
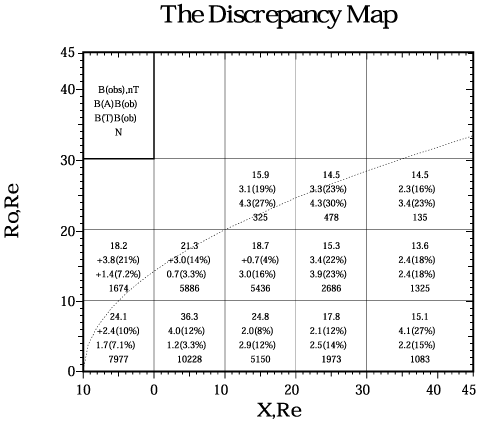
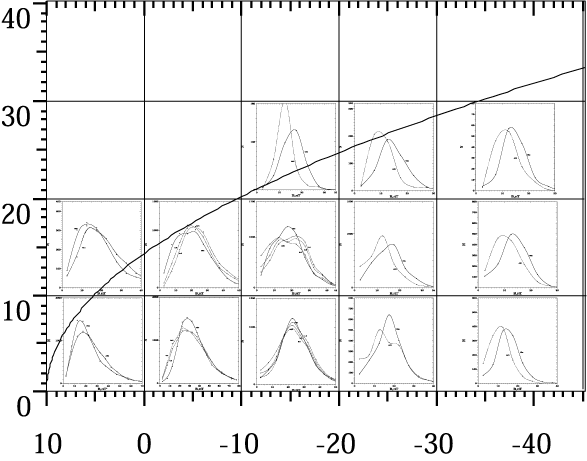
Figure 2: The distribution of the discrepancies of
magnetospheric magnetic field calculated in term of the paraboloid model A99,
compared with experimental data. In the singled out cell the format of data is
shown: B(sc)\protect ,nT, is the measured onboard spacecrafts
magnetic field averaged in cells, B(mod)\protect ,nT, is the
average field calculated in terms of the paraboloid model, N is for
statistics.

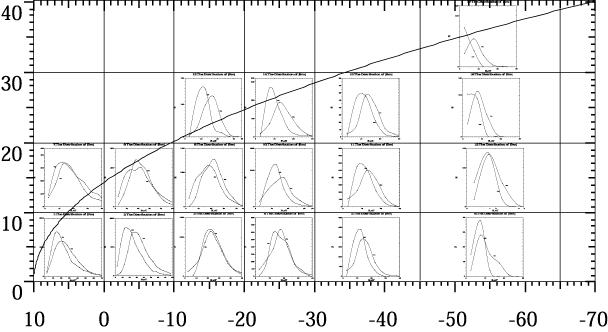
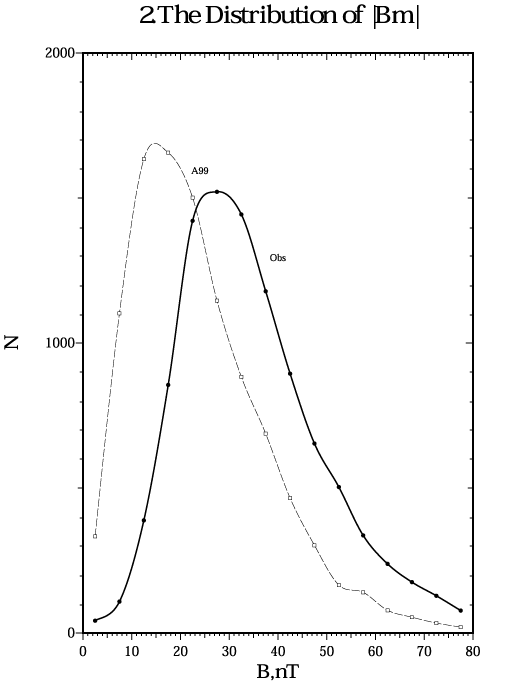
Figure 3:
The magnetic field module distributions
in the different cells of the
magnetosphere, measured (solid line) and calculated by paraboloid model A99
(thin line).
Fig.1 and 2 represent this comparison in the form of the distribution of
discrepancies. The histogram in Fig.1 shows the distribution of relative
discrepancies D=[(B(sc)-B(mod))/B(sc)]·100% integral over the
whole experimental material (45181 measurements). The discrepancy mean value is
about +3% (the distribution is asymmetric with a long negative
"tail"), s of the distribution being of ~ 80% . Fig. 2 presents the distribution of absolute and relative
discrepancies differential in x and r, where r = Ö{y2+z2} , x,y,z are the solar-magnetospheric (GSM)
coordinates. The weight of each discrepancy value (statistics) is shown in the
corresponding cell in x and r. An examination of the Fig.2
shows that near the Earth at distances about the geostationary orbit in the
magnetosphere nightside the discrepancy is, on average, 12.3 nT for -10 < x Ł 0 and 0 Ł r < 10 , and in the magnetosphere dayside it
is, on average, 3.4 nT for 0 < x Ł 10 and 0 Ł r < 10 .
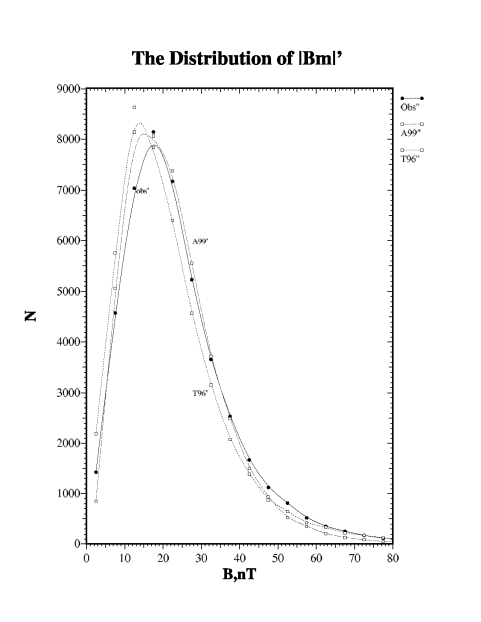
The magnetic field module distributions in the different cells of the
magnetosphere, measured and calculated by paraboloid model are represented in
the Figure 3. The measured magnetic field has also an own non-Gaussian
distribution in each cell. The mean values and discrepancies represented in the
Fig. 2 are the measured magnetic field distribution mean values and mean
discrepancies between measured and calculated values. The calculated by
paraboloid model magnetic field is distributed in a good agreement with
observations.

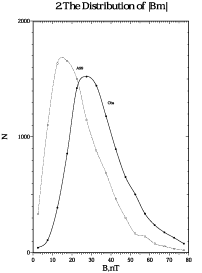
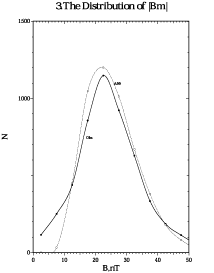
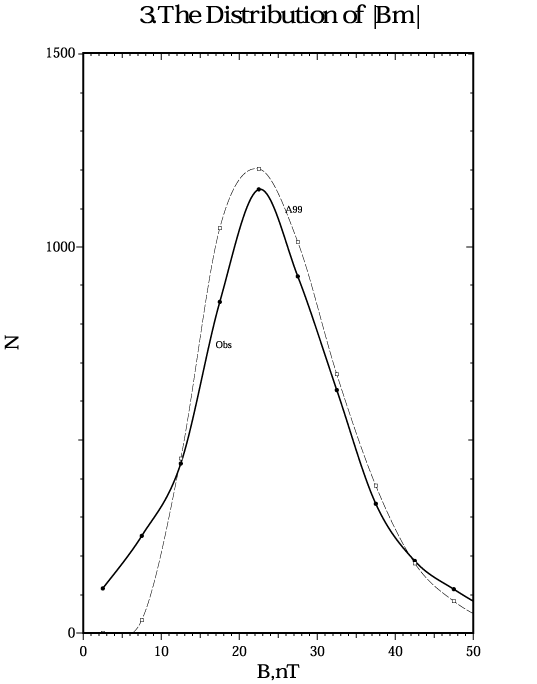
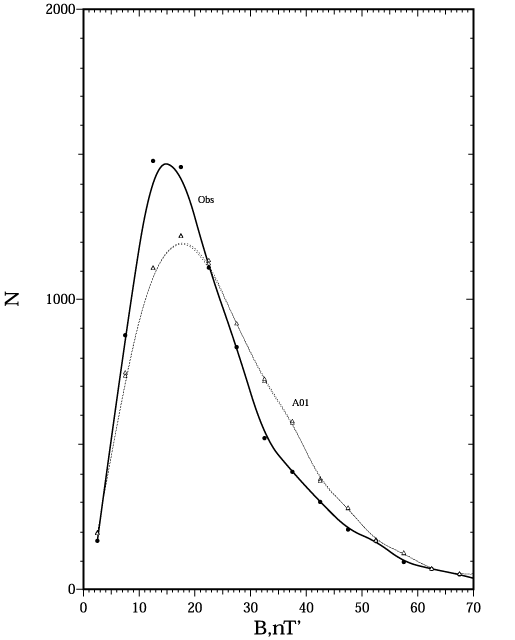
Figure 4: The magnetic field module distributions
(measured and calculated by A99) in the near-Earth (x,r) cells (10:0;
0:10), (0:-10; 0:10), (-10:-20; 0:10) of the
magnetosphere.
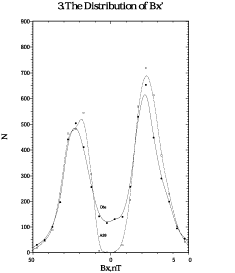
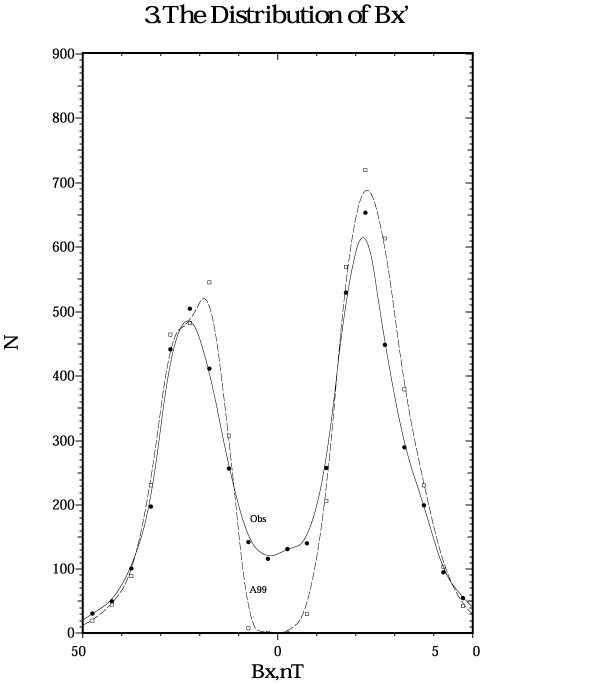
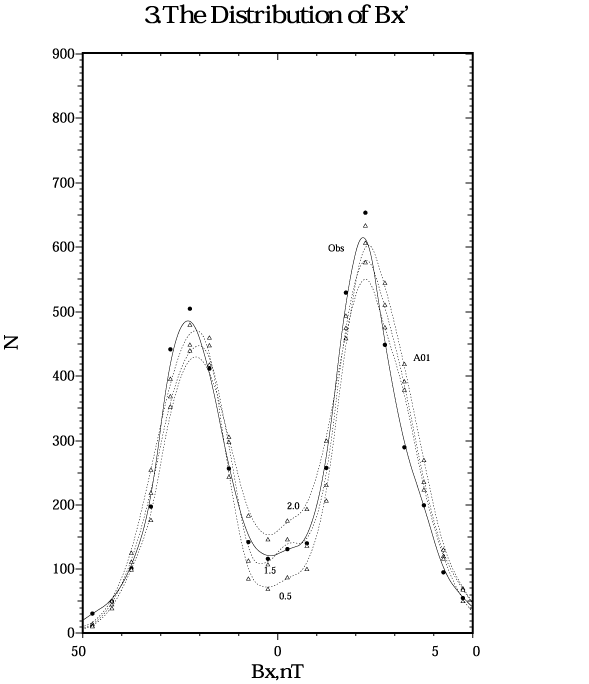
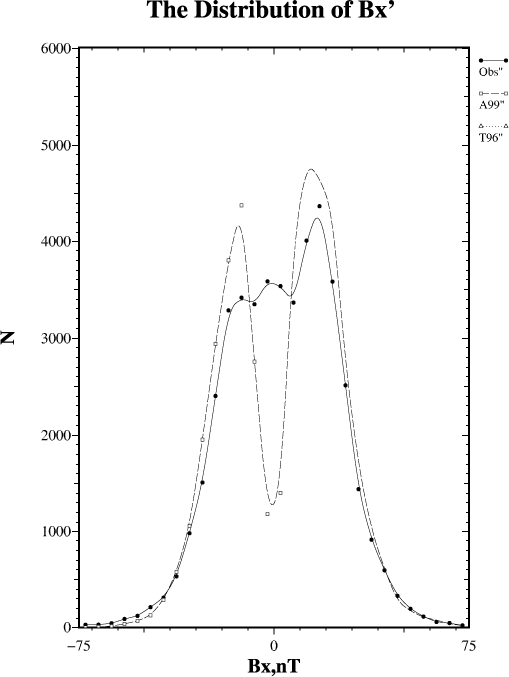
Figure 5:
The same as in the Fig. 4 for GSM Bx
component of the magnetospheric magnetic field.
Fig.4 represents the distributions in (x, r) cells (10:0; 0:10), (0:-10;
0:10), (-10:-20; 0:10) respectively. The first and second cells demonstrate the
regular shifts: the magnetic field in the night side is underestimated and in
the dayside is overestimated. Such behavior can be explained by field aligned
currents effect which is not taken into account in these calculations. The
quite good agreement exists in the third cell.
Fig. 5 represents the same comparison for the GSM Bx component of the magnetic
field in the (x, r) cell (-10:-20; 0:10). The distribution depression
near the Bx=0 corresponds the measurements which were made in the tail plasma
sheet region. The A99 paraboloid model has infinite thin tail current so the
Bx values which are near zero are absent.
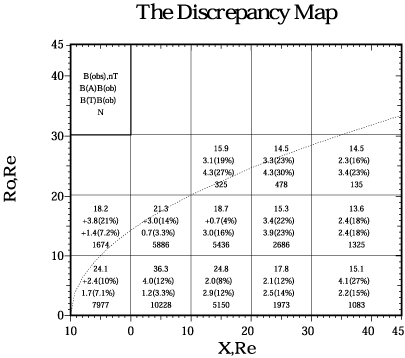
Figure 6: The same as in the Fig. 3, calculated in
terms of A01 and T96 models
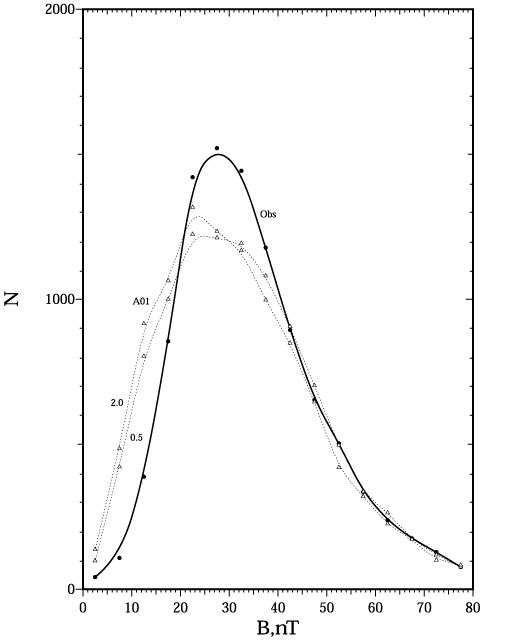
Paraboloid model allows flexible taking into account the new magnetospheric
magnetic field sources. Moreover, because each magnetospheric magnetic field
source with its own screening currents is calculated separately and depends
linearly on its own input parameters we can change the parametrization of
current systems to match better the data. To take into account the mentioned
above effects of field aligned currents and "thin" tail current the new "beta"
version of paraboloid model (A01) was developed. The "thin geotail" magnetic
field [Alexeev and Bobrovnikov, 1997] and field aligned current magnetic
field [Alexeev, Belenkaya and Clauer, 2001] were taken into account. Fig. 6 shows
the measured magnetic field module mean values in the different cells of the
magnetosphere as well as mean discrepancies between the measured magnetic field
and calculated by A01 (second row) and T96 (third row). The more good agreement
for A01 is detected in the near-Earth region than that represented in the
Figure 2. We can see that in general, the obtained in terms of A01/A99
discrepancies are of the same order as those obtained in the framework of T96
model [Tsyganenko, 1995].
*12cm!
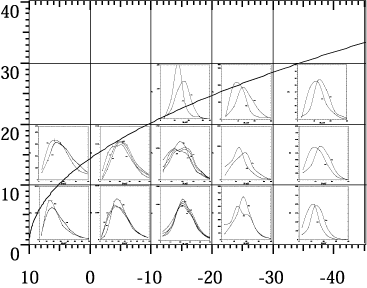
Figure 7: The magnetic field module distributions over
the whole statistics in the different cells in the Earth's magnetosphere,
measured and calculated by A01 model.
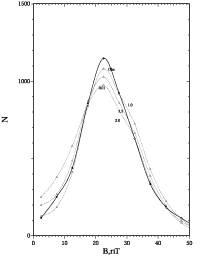
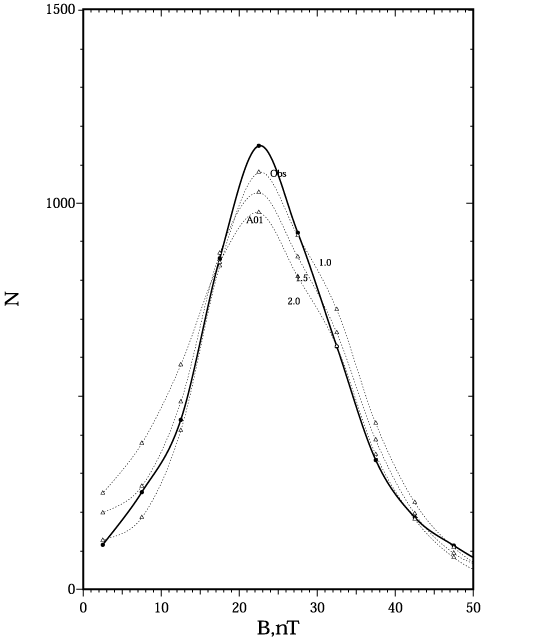
Figure 8: The same as in the fig. 4 for magnetic field
module calculated by A01 model.
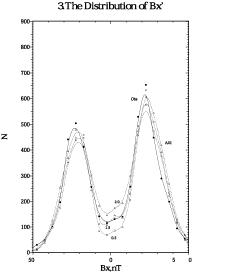
Figure 9: The same as in the fig. 8 for Bx component
of the magnetospheric magnetic field.
The magnetic field module distributions in the different cells of the
magnetosphere, measured and calculated by paraboloid model are represented in
the Figure 7. The magnetic field distributions measured in the near-Earth's
cells represented in the Figures 8 (magnetic field module) and 9 (Bx
component). The distributions of the magnetic field calculated for the
different parametrizations of the tail current and field aligned currents
demonstrate the more good agreement with experimental data than that obtained
in the framework of A99 paraboloid model.
The results represented on the Fig. 6 shows that paraboloid model, analytical
and based on the small number of the input parameters, describes the large
array of experimental data with approximately the same accuracy as the T96
model, which constructed as approximation of that array by the chosen by author
functions with the chosen number of parameters. Fig. 10 represents the
distributions of measured and calculated by A99 and T96 models magnetic fields
(module and Bx component, respectively).
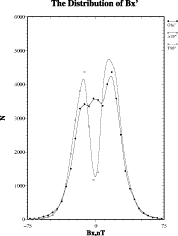
Figure 10: The same as in the fig. 8 for Bx component
of the magnetospheric magnetic field.
In the Table 1 the comparison of magnetic field calculated by paraboloid model
(A99) Tsyganenko model (T96) and measured magnetic field from Large
Magnetosphere Magnetic Field Data Base averaged by the levels of disturbances
is presented. We can see that only for very quite conditions T96 model gives
the better results than A99. For Kp between 1- and 2-
the results are comparable, but for disturbed conditions ( Kp > 2 ) A99 gives
the better results than T96. The T96 (as the earlier Tsyganenko models) was
constructed using the minimization of the deviation from a data set of the
magnetospheric magnetic field measurements gathered by several spacecrafts
during many years. The disturbed periods are relatively rare events during the
observation time, so their influence on the model coefficients is negligibly
small. That is why the T96 model's applicability is limited by Dst,BzIMF, and the solar wind dynamic pressure low values.
| Kp | A99 | T96 | Data |
| 0,0+ | 13.8 | 14.9 | 15.5 |
| 1-,1 | 16.9 | 16.3 | 17.6 |
| 1+,2- | 18.3 | 18.6 | 20.3 |
| 2,2+ | 21.6 | 20.6 | 22.6 |
| 3-,3,3+ | 25.3 | 24.1 | 26.3 |
| 4-,4,4+ | 30.0 | 28.1 | 31.3 |
| 5-,5 | 34.8 | 33.4 | 35.4 |
Table 1: Comparison of magnetic field calculated by paraboloid
model (A99) Tsyganenko model (T96) and measured magnetic field from Large Magnetosphere
Magnetic Field Data Base averaged by the levels of disturbances.
Acknowledgments.
The authors thank N. Tsyganenko NASA GSFC for the magnetosphere magnetic field
database.
References
Alexeev, I. I., Regular magnetic field in the Earth's
magnetosphere, Geomagn. Aeron., Engl. Transl., 18, 447,
1978.
Alexeev, I. I., E. S. Belenkaya, and C. R. Clauer,
A model of region 1 field-aligned currents dependent on ionospheric
conductivity and solar wind parameters, J. Geophys.
Res.,
105, 21,119, 2000.
Alexeev, I. I., and S. Y. Bobrovnikov, Tail current
sheet
dynamics
during substorm (in Russian), Geomagn. Aeron., 37, 5, 24, 1997.
Faierfield et al., A large magnetosphere magnetic field database,
J. Geophys.
Res.,
99, 11,319,
1994.
Reeves et al., The relativistic electron response at geosynchronous
orbit
during the January 1997 magnetic storm, J. Geophys. Res., 103,
17,559, 1998.
Tsyganenko, N.A., Modeling the Earth's magnetospheric
magnetic
field confined within a realistic magnetopause, J. Geophys.
Res., 100,
5599, 1995.
Turner, N. E., D. N. Baker, T. I. Pulkkinen, and R. L. McPherron,
Evaluation of the tail current contribution to Dst, J.
Geophys. Res.,
105, 5431, 2000.